- Analítica
- Análise Técnica
GBP/USD Análise técnica - GBP/USD Negociação: 2019-07-22
Getting ready for parliamentary elections in the UK
July 22, 2019 in the UK, members of the ruling Conservative Party will vote.Will the British pound quotations grow up?
According to the results of the voting, not only the head of the British Conservative Party will be elected, but also the head of parliament and the successor of Theresa May as prime minister of Great Britain. The main contender for this post is Boris Johnson. US President Donald Trump has stated that he supports his candidacy and will work with him. Trump also thanked Johnson for his efforts in quickly organizing Brexit. Recalling that the exit of the UK from the EU should be held October 31, 2019. US support may help strengthen the British currency. Another positive factor for the pound was an unexpected increase in retail sales in the UK in June by 1% compared with May, which is noticeably more than preliminary forecasts. Now economists can reconsider the possible growth of GDP in the 2nd and 3rd quarters upwards.
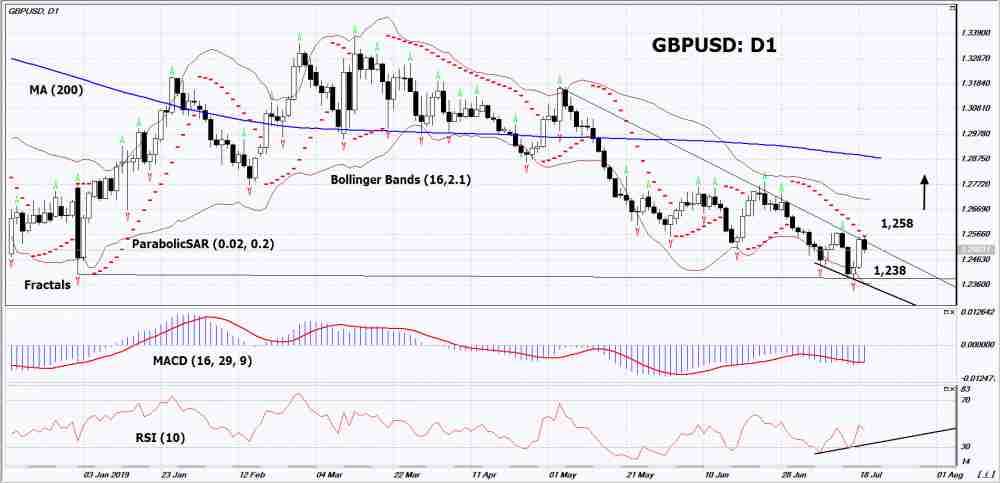
On the daily timeframe GBPUSD: D1 adjusted up from a 15-month low. Various technical analysis indicators have generated uptrend signals. Further growth of quotations is possible in case of publication of positive macroeconomic data and positive Brexit.
- The Parabolic indicator indicates downtrend signal. It can be used as an additional resistance level that must be overcome before opening a buy position.
- The Bolinger bands narrowed, indicating a volatility decrease. Both lines slope upwards.
- The RSI indicator is below 50. It has formed a divergence to increase.
- The MACD indicator shows a signal to increase.
The bullish momentum may develop if GBPUSD will exceed its last upper fractal and Parabolic signal: 1,258. This level can be used as an entry point. The initial stop loss may be placed below the 15-month low and the last lower fractal: 1.238. After the opening of a pending order, stop shall be moved following the signals of Bollinger and Parabolic to the next fractal minimum. Thus, we are changing the potential profit/loss to the breakeven point. More risk-averse traders may switch to the 4-hour chart after the trade and place a stop loss moving it in the direction of the trade. If the price meets the stop level (1,238) without reaching the order (1,258), we recommend to cancel the order: the market sustains internal changes that were not taken into account.
Technical Analysis Summary
| Position | Buy |
| Buy stop | Above 1,258 |
| Stop loss | Below 1,238 |
- Obtenha certificado

Nota de rodapé:
Esta visão geral é apenas para fins informativos e educacionais, e é publicada de forma gratuita. Todos os dados contidos neste documento são obtidos de fontes públicas que são consideradas mais ou menos confiáveis. Ao mesmo tempo, não há garantias de que as informações são completas e precisas. No futuro, as visões separadas não são atualizadas. Todas as informações em cada visão geral, incluindo opiniões, índices, gráficos etc., são apresentadas apenas para fins informativos e não são aconselhamentos financeiros ou recomendações. Todo o texto e qualquer parte dele, assim como os gráficos não podem ser considerados como uma oferta para realizar quaisquer transações com qualquer ativo. A empresa IFC Markets e seus funcionários sob nenhumas circunstâncias não são responsáveis por quaisquer acções, realizados por uma pessoa durante ou depois de ler a visão geral.
