- Analítica
- Análise Técnica
Indice Dolar Análise técnica - Indice Dolar Negociação: 2016-05-16
Retail sales climb in US
US dollar index hit a fresh 2-week high on Friday on strong economic data. Market participants decided the Fed may hike the interest rates twice this year instead of previously expected one hike. Will the US dollar index continue advancing?
US retail sales rose this April by 1.3% which has become their record increase in more than a year – since March 2015. This is far above the expected rise by 0.8%. The consumer confidence index by Michigan University for May was also above expectations. Since last June it has reached the record high since last June at 95.8 points. On this news some investors revised up the US GDP growth outlook for Q1 from 0.5% to 0.9%. The official data will be released on May 27. The US economy is expected to expand by about 2% in Q2. The probability of the first US interest rate hike on September 21 is 60%. Before the date the US Fed will meet in June and July. The important US inflation data for April will come out next Tuesday. We believe the preliminary forecasts point on further US dollar strengthening.
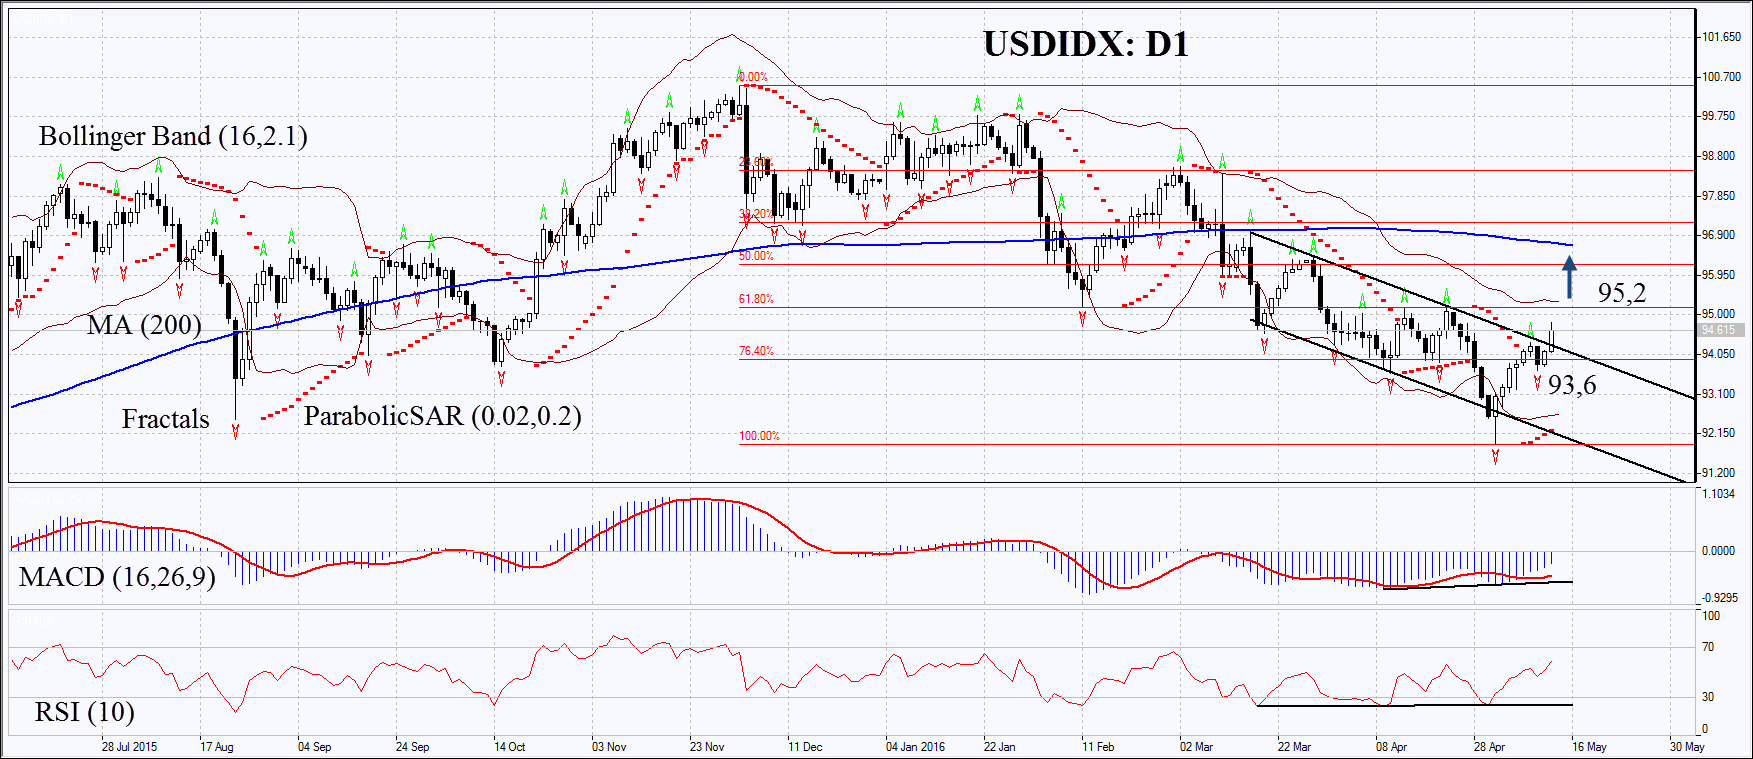
On the daily chart USDIDX: D1 has left the downtrend to move upwards. It has left the last fractal high, the support line and the 1st Fibonacci retracement. The MACD and Parabolic indicators give signals to buy. RSI has formed positive divergence and has not yet reached the overbought zone. The Bollinger bands have contracted which means lower volatility and are tilted upwards. The bullish momentum may develop in case the US dollar index surpasses the second fractal high and the 2nd Fibonacci retracement at 95.2. This level may serve the point of entry. The initial risk-limit may be placed below the broken support of the downtrend and the last fractal low at 93.6. Having opened the pending order we shall move the stop to the next fractal low following the Parabolic and Bollinger signals. Thus, we are changing the probable profit/loss ratio to the breakeven point. The most risk-averse traders may switch to the 4-hour chart after the trade and place there a stop-loss moving it in the direction of the trade. If the price meets the stop-loss level at 93.6 without reaching the order at 95.2, we recommend cancelling the position: the market sustains internal changes which were not taken into account.
| Position | Buy |
| Buy stop | above 95.2 |
| Stop loss | below 93.6 |
- Obtenha certificado

Nota de rodapé:
Esta visão geral é apenas para fins informativos e educacionais, e é publicada de forma gratuita. Todos os dados contidos neste documento são obtidos de fontes públicas que são consideradas mais ou menos confiáveis. Ao mesmo tempo, não há garantias de que as informações são completas e precisas. No futuro, as visões separadas não são atualizadas. Todas as informações em cada visão geral, incluindo opiniões, índices, gráficos etc., são apresentadas apenas para fins informativos e não são aconselhamentos financeiros ou recomendações. Todo o texto e qualquer parte dele, assim como os gráficos não podem ser considerados como uma oferta para realizar quaisquer transações com qualquer ativo. A empresa IFC Markets e seus funcionários sob nenhumas circunstâncias não são responsáveis por quaisquer acções, realizados por uma pessoa durante ou depois de ler a visão geral.
