- Analítica
- Análise Técnica
Índice de ações australiano Análise técnica - Índice de ações australiano Negociação: 2020-10-09
ĺndice da bolsa australiana Resumo da Análise Técnica
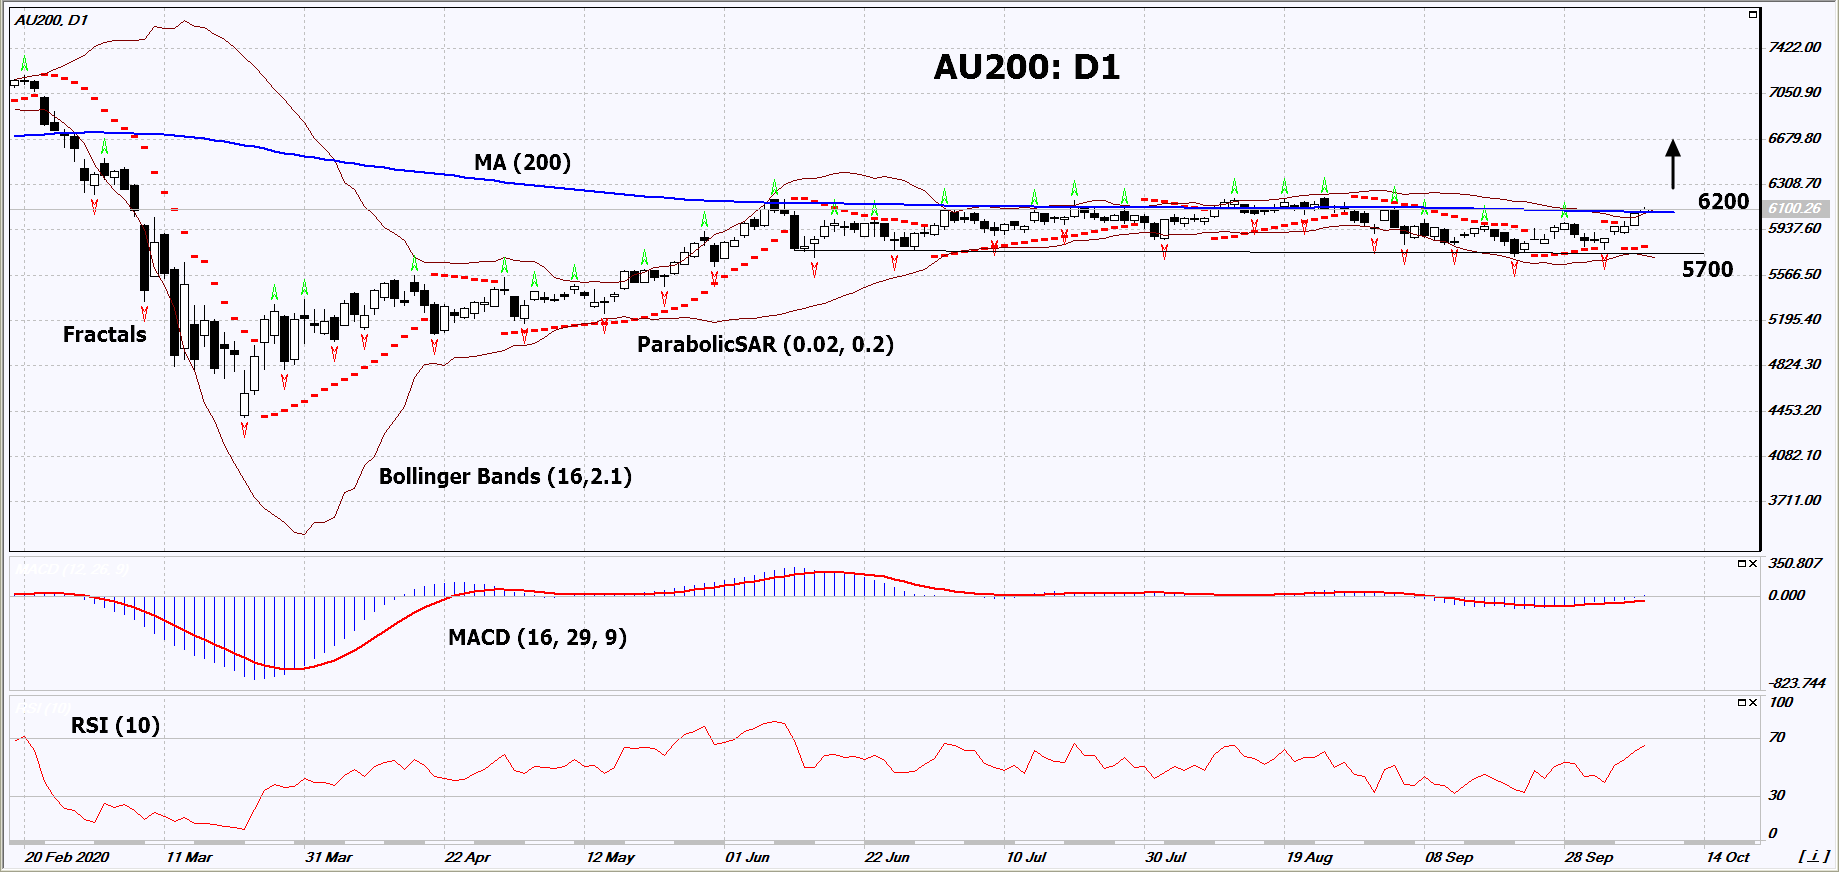
acima de 6200
Buy Stop
abaixo de 5700
Stop Loss
| Indicador | Sinal |
| RSI | Neutro |
| MACD | Comprar |
| MA(200) | Neutro |
| Fractals | Neutro |
| Parabolic SAR | Comprar |
| Bollinger Bands | Neutro |
ĺndice da bolsa australiana Análise gráfica
ĺndice da bolsa australiana Análise Técnica
On the daily timeframe, AU200: D1 is being traded in a narrow neutral range for the 5th month already. It must be broken upward before opening a position. A number of technical analysis indicators formed signals for further growth. We do not rule out a bullish move if AU200 rises above the 200-day MA and Bollinger Upper Line: 6200. This level can be used as an entry point. We can place a stop loss below the Parabolic signal, the lower Bollinger line, the 2 last lower fractals: 5700. After opening a pending order, we move the stop loss following the Bollinger and Parabolic signals to the next fractal minimum. Thus, we change the potential profit/loss ratio in our favor. After the transaction, the most risk-averse traders can switch to the four-hour chart and set a stop loss, moving it in the direction of the trend. If the price meets the stop loss (5700) without activating the order (6200), it is recommended to delete the order: some internal changes in the market have not been taken into account.
Análise Fundamental de Índices - ĺndice da bolsa australiana
The recent growth of commodity prices could help strengthen the Australian economy, which is a major exporter of commodities. Will AU200 quotes grow ?
Australia's GDP fell 7% in the 2nd quarter of 2020. This is less than in the European Union (-11.8%), the USA (-31.4%), Japan (-7.9%) and other developed countries. Reserve Bank of Australia (RBA) at its meeting on October 6 kept the rate at a historic low of 0.25% and announced its readiness to further ease monetary policy in order to stimulate the Australian economy. Investors expect the RBA rate to drop to 0.1% in November and the launch of the bond buyback program. This could support the rise in the S&P/ASX 200 stock index. Australia exports a range of commodities and minerals: mainly coal, oil and liquefied natural gas, various ores and metals, including non-ferrous and precious ones. They account for approximately 45% of exports and another 10% includes meat, grain crops and other agricultural products.
Explore nossas
condições de trading
- Spreads a partir de0.0 pip
- 30,000+ Ferramentas de Trading
- Nível de Stop Out - Apenas 10%
Ready to Trade ?
Abrir Conta Nota de rodapé:
Esta visão geral é apenas para fins informativos e educacionais, e é publicada de forma gratuita. Todos os dados contidos neste documento são obtidos de fontes públicas que são consideradas mais ou menos confiáveis. Ao mesmo tempo, não há garantias de que as informações são completas e precisas. No futuro, as visões separadas não são atualizadas. Todas as informações em cada visão geral, incluindo opiniões, índices, gráficos etc., são apresentadas apenas para fins informativos e não são aconselhamentos financeiros ou recomendações. Todo o texto e qualquer parte dele, assim como os gráficos não podem ser considerados como uma oferta para realizar quaisquer transações com qualquer ativo. A empresa IFC Markets e seus funcionários sob nenhumas circunstâncias não são responsáveis por quaisquer acções, realizados por uma pessoa durante ou depois de ler a visão geral.

