- Analítica
- Análise Técnica
AUD/CAD Análise técnica - AUD/CAD Negociação: 2020-10-19
AUD/CAD Resumo da Análise Técnica
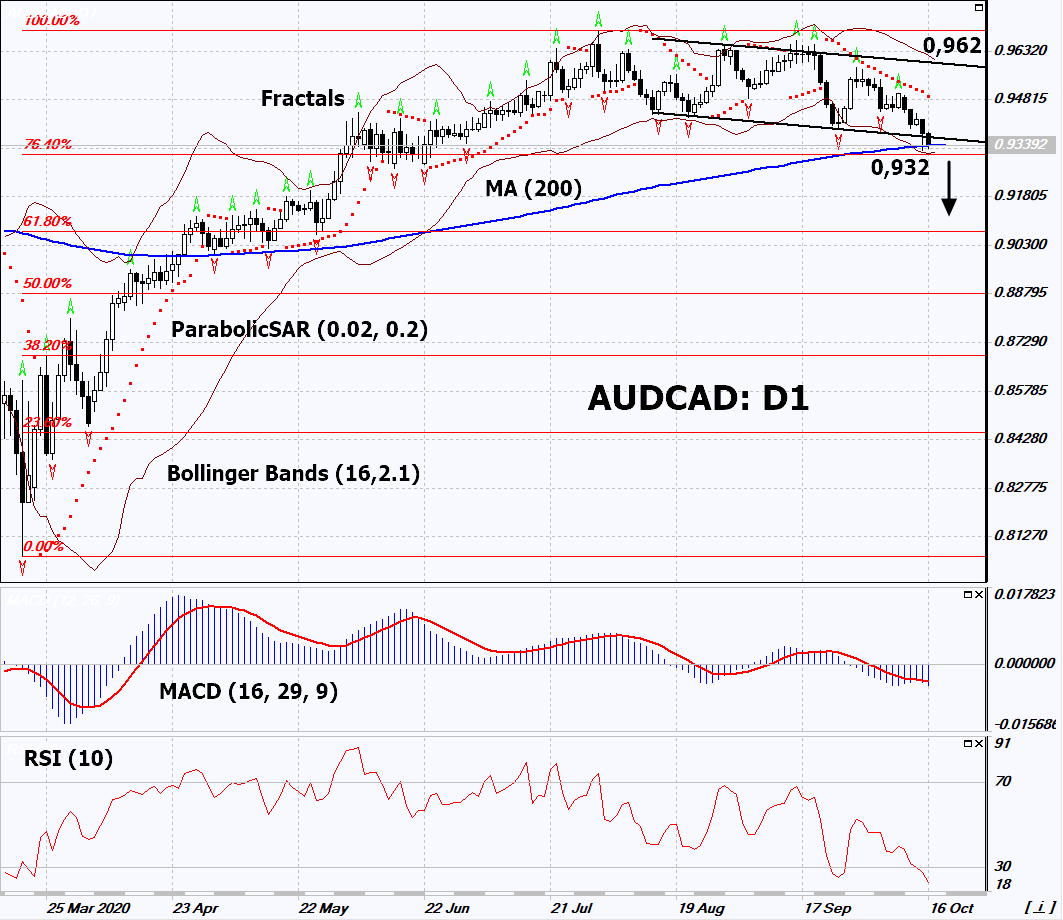
abaixo de 0.932
Sell Stop
acima de 0.962
Stop Loss
| Indicador | Sinal |
| RSI | Neutro |
| MACD | Vender |
| MA(200) | Neutro |
| Fractals | Vender |
| Parabolic SAR | Vender |
| Bollinger Bands | Neutro |
AUD/CAD Análise gráfica
AUD/CAD Análise Técnica
On the daily timeframe, AUDCAD: D1 is correcting down from its maximum since December 2018. It broke down the support line of the downtrend, and the downturn may accelerate. A number of technical analysis indicators formed signals for further decline. We do not rule out a bearish movement if AUDCAD falls below the 200-day moving average and the lower Bollinger band: 0.932. This level can be used as an entry point. We can set a stop loss above the last 2 upper fractals, the upper Bollinger band and the Parabolic signal: 0.962. After opening a pending order, we move the stop loss to the next fractal maximum following the Bollinger and Parabolic signals. Thus, we change the potential profit/loss ratio in our favor. After the transaction, the most risk-averse traders can switch to the four-hour chart and set a stop loss, moving it in the direction of the bias. If the price meets the stop loss (0.932) without activating the order (0.962), it is recommended to delete the order: there are internal changes in the market that have not been taken into account.
Análise Fundamental de Forex - AUD/CAD
Last week, the Australian dollar was the weakest among the currencies of the G10 countries due to expectations of a rate cut. Will the AUDCAD quotations continue to drop?
The downward movement of this currency pair signifies the weakening of the Australian dollar against the Canadian. The next Reserve Bank of Australia (RBA) meeting will take place on November 3. The rate is expected to decrease from 0.25% to 0.1%. The deterioration of the US-China trade relations was another negative factor for the Australian dollar, as China is Australia's main trading partner. Last week, China imposed a ban on imports of Australian coal. Previously, China limited the supply of wine, beef and barley from Australia. Chinese customs have not yet revealed the reasons for such bans. In turn, the stability of the Canadian dollar can be supported by relatively high world prices for oil and natural gas - the basis of Canada's exports. On Wednesday, investors expect Canadian inflation data and Australian retail sales.
Explore nossas
condições de trading
- Spreads a partir de0.0 pip
- 30,000+ Ferramentas de Trading
- Nível de Stop Out - Apenas 10%
Ready to Trade ?
Abrir Conta Nota de rodapé:
Esta visão geral é apenas para fins informativos e educacionais, e é publicada de forma gratuita. Todos os dados contidos neste documento são obtidos de fontes públicas que são consideradas mais ou menos confiáveis. Ao mesmo tempo, não há garantias de que as informações são completas e precisas. No futuro, as visões separadas não são atualizadas. Todas as informações em cada visão geral, incluindo opiniões, índices, gráficos etc., são apresentadas apenas para fins informativos e não são aconselhamentos financeiros ou recomendações. Todo o texto e qualquer parte dele, assim como os gráficos não podem ser considerados como uma oferta para realizar quaisquer transações com qualquer ativo. A empresa IFC Markets e seus funcionários sob nenhumas circunstâncias não são responsáveis por quaisquer acções, realizados por uma pessoa durante ou depois de ler a visão geral.

