- Analítica
- Análise Técnica
EUR/ZAR Análise técnica - EUR/ZAR Negociação: 2020-08-19
EUR/ZAR Resumo da Análise Técnica
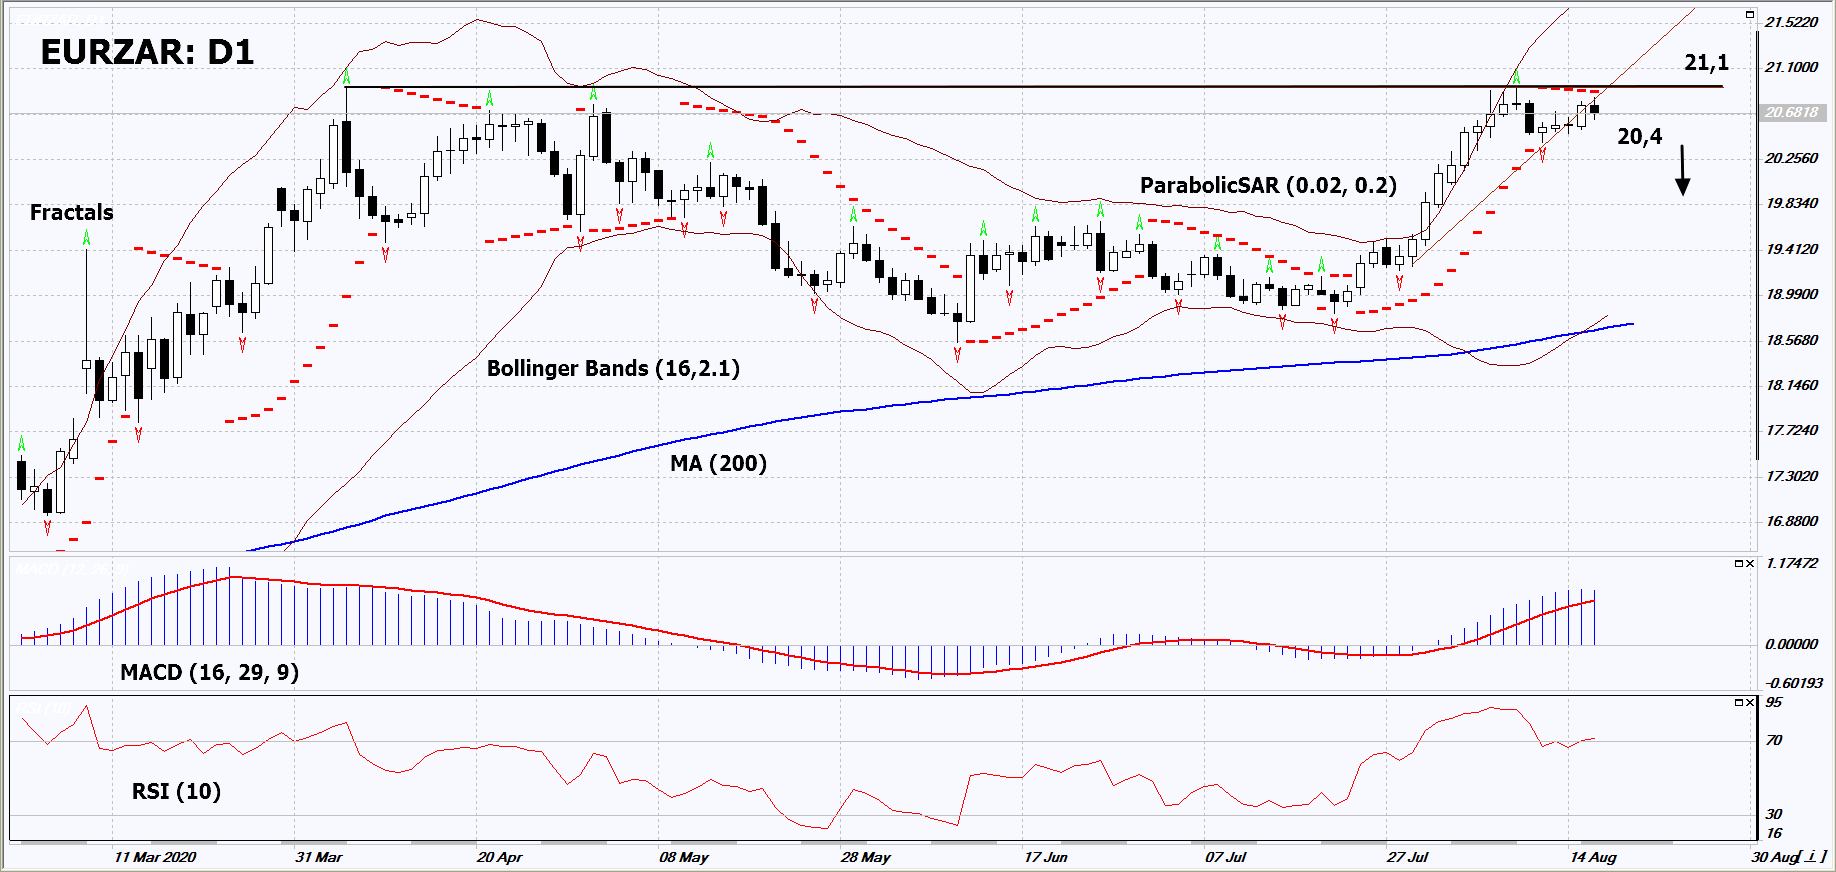
abaixo de 20,4
Sell Stop
acima de 21,1
Stop Loss
| Indicador | Sinal |
| RSI | Neutro |
| MACD | Neutro |
| MA(200) | Neutro |
| Fractals | Neutro |
| Parabolic SAR | Vender |
| Bollinger Bands | Neutro |
EUR/ZAR Análise gráfica
EUR/ZAR Análise Técnica
On the daily timeframe, EURZAR: D1 approached the resistance line of the long-term neutral trend. So far it hasn't been able to overcome it and is trying to correct downward now. A number of technical analysis indicators generated signals for further decline. We do not rule out a bearish move if EURZAR falls below its last low fractal: 20.4. This level can be used as an entry point. The stop loss can be placed above the last upper fractal and Parabolic signal: 21.1. After opening a pending order, the stop loss should be moved following the Bollinger and Parabolic signals to the next fractal low. Thus, we change the potential profit/loss ratio in our favor. After the transaction the most risk-averse traders can switch to the four-hour chart and set a stop loss, moving it in the direction of the bias. If the price meets the stop loss (21.1) without activating the order (20.4), it is recommended to delete the order: some internal changes in the market were not taken into account.
Análise Fundamental de Forex - EUR/ZAR
In this review, we want to consider the dynamics of the Euro against the South African rand. Is the decline in EURZAR quotes possible?
The downward movement means the strengthening of the South African rand and the weakening of the euro. South African Reserve Bank rate is 3.5% with inflation rate of 2.2% in annual terms. The ECB rate is zero with inflation rate of 0.4%. Rising prices for precious and non-ferrous metals, as well as for other mineral raw materials, may help strengthen the South African rand. A possible risk for the euro could be the outcome of the European Council’s emergency summit on the situation in Belarus. It will take place on Wednesday. Note that both the EU and South Africa will release construction data on Thursday.
Explore nossas
condições de trading
- Spreads a partir de0.0 pip
- 30,000+ Ferramentas de Trading
- Nível de Stop Out - Apenas 10%
Ready to Trade ?
Abrir Conta Nota de rodapé:
Esta visão geral é apenas para fins informativos e educacionais, e é publicada de forma gratuita. Todos os dados contidos neste documento são obtidos de fontes públicas que são consideradas mais ou menos confiáveis. Ao mesmo tempo, não há garantias de que as informações são completas e precisas. No futuro, as visões separadas não são atualizadas. Todas as informações em cada visão geral, incluindo opiniões, índices, gráficos etc., são apresentadas apenas para fins informativos e não são aconselhamentos financeiros ou recomendações. Todo o texto e qualquer parte dele, assim como os gráficos não podem ser considerados como uma oferta para realizar quaisquer transações com qualquer ativo. A empresa IFC Markets e seus funcionários sob nenhumas circunstâncias não são responsáveis por quaisquer acções, realizados por uma pessoa durante ou depois de ler a visão geral.


